PulsarOps AI Book a demo
Platform

Advanced triage. Advanced troubleshooting. AI-based recommendations. One unified platform.

Everything your NOC needs to move from reactive firefighting to proactive operations.
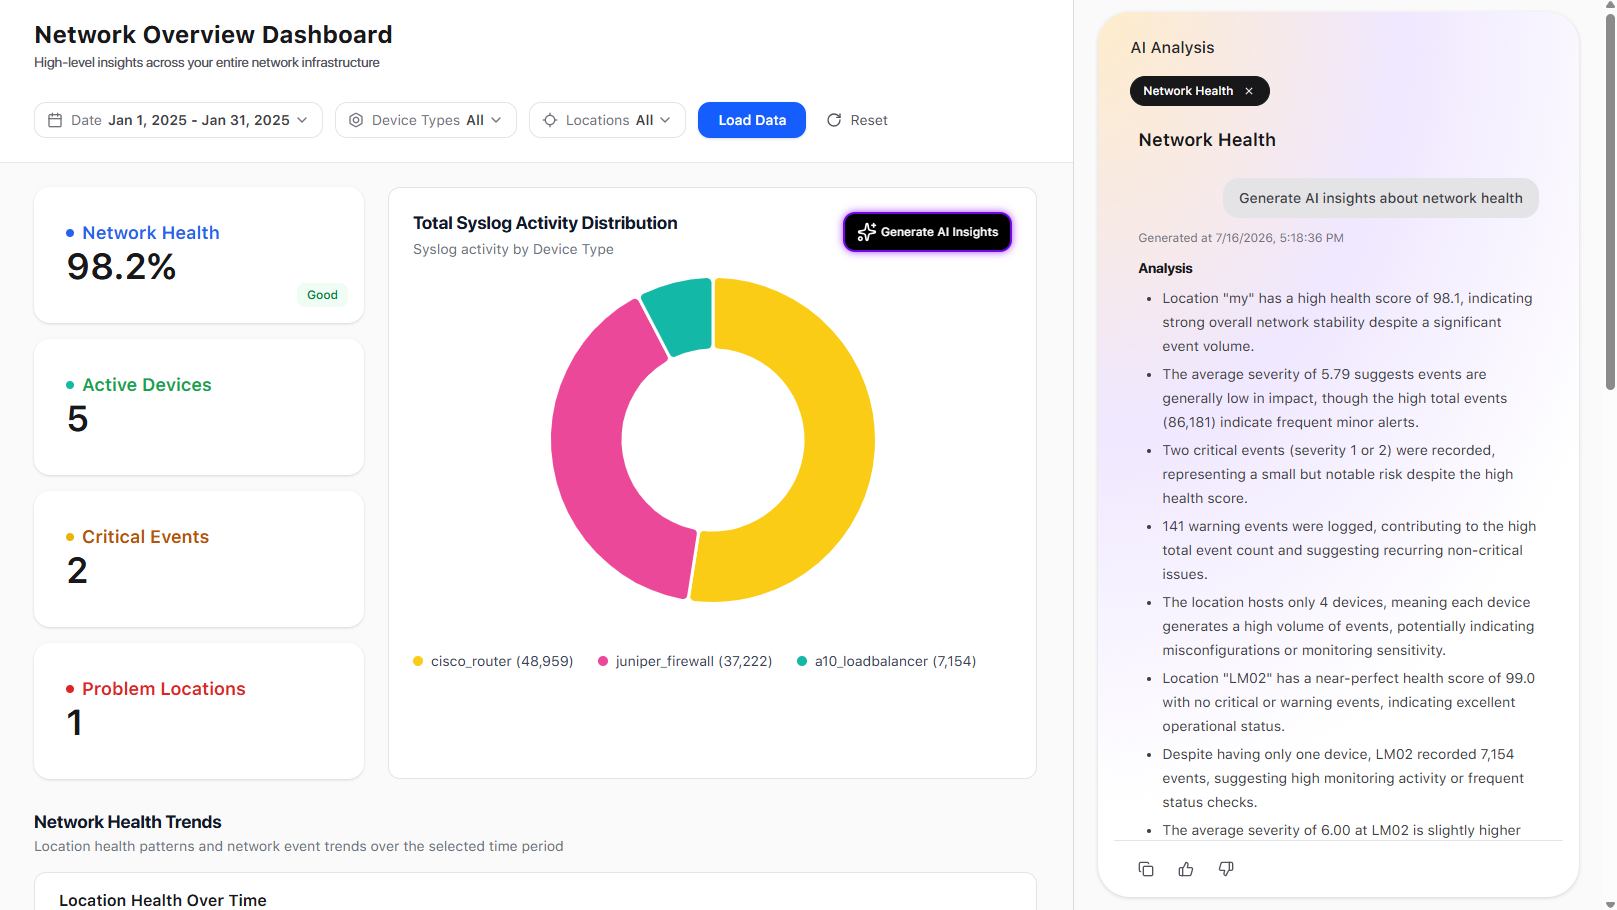
Network overview
Network overview dashboard listing devices, interface error counts and correlated event groups.
A day in the life

Network engineer: the port-flapping morning.

Four steps from early warning to a recommended next step.

  1. 1 Early warning

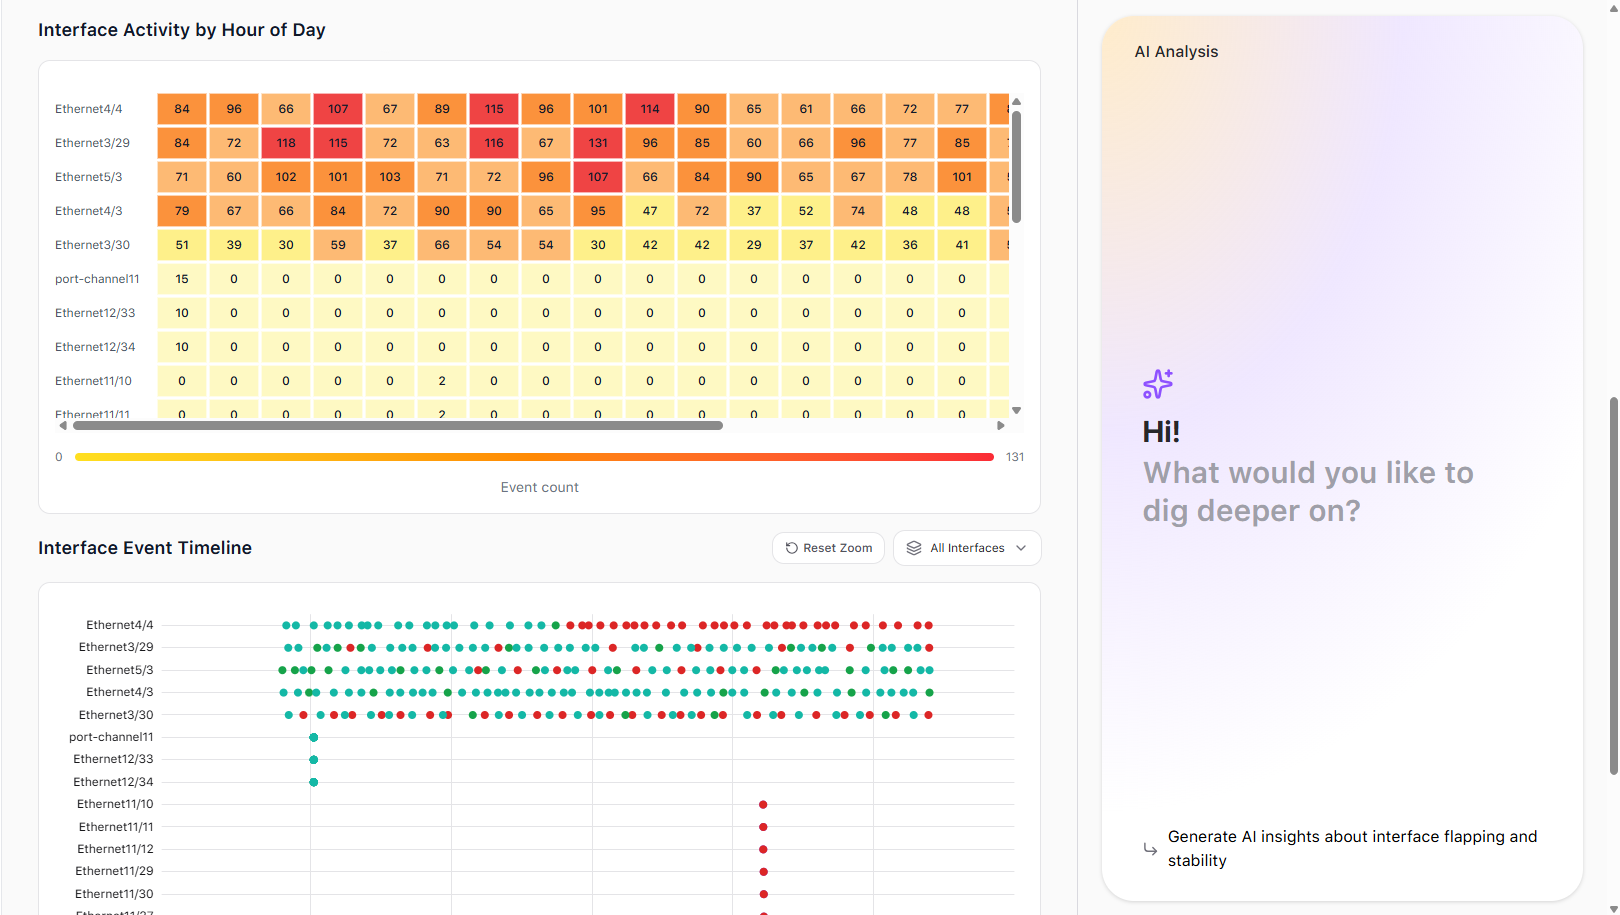
    Heat map flags the interface errors

    • Degradation surfaces before it becomes an outage
  2. 2 Drill down

    Drill down to the interface level

    • Errors and discards charted per interface over time
  3. 3 Correlate

    Correlate across interfaces and devices

    • Similar events grouped instead of listed one by one
  4. 4 Act

    The assistant recommends next steps

    • A recommended action attached to the finding

One platform. Four stages.

01 - Ingest @ scale

Data as it arrives

  • Syslogs and application logs
  • Configuration files and inventory
  • Topology

Real-time and historical, multi-vendor

02 - Analyze @ scale

Analysis and evidence

  • Latest LLMs, agentic RAG
  • ML-based classification and anomaly detection
  • Pattern-based correlation

Millions of events, minutes not hours

03 - Insights @ scale

Trends and root cause

  • Early warning trends
  • Root cause analysis
  • AI analysis and recommendations

Human-centric, evidence-backed

04 - Execute @ scale

Action and remediation

  • Interactive assistant
  • Agentic workflows
  • Remediation next steps

Advises your engineers, never replaces them

Capabilities

Everything triage needs, in one platform.

Multi-vendor streaming data ingestion

A data pipeline that ingests real-time and historical data.

Multi-device correlation

Connects events across interfaces or devices to group similar events.

Agentic RAG assistant

Ask in plain language. Get evidence-backed answers.

ML-based log classification and analysis

Sorts and extracts patterns from millions of events by type and frequency.

Early warning trends

Surfaces degradation before it becomes an outage.

Root cause and next steps

Every finding comes with a recommended action.
See it working

Real screens. Real results.

Key feature 01

AI-powered troubleshooting and diagnostics

  • Collect data in real time through an adaptive ingest pipeline and device library.
  • Run interactive queries across logs, config files and performance metrics.
  • Find root causes faster with ML-based algorithms.
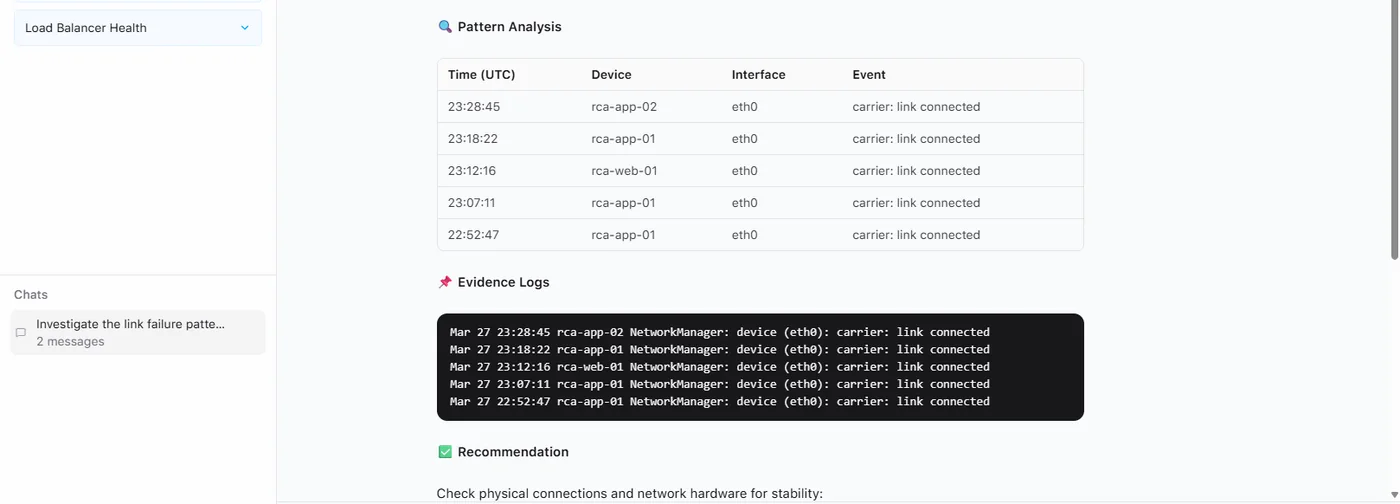
AI assistant
AI assistant answer showing a pattern analysis table, the evidence log lines and a recommendation.
Key feature 02

Real-time trends and insight visualization

  • See conditions across devices before issues become outages.
  • Recognize patterns and developing problems in network logs.
  • Surface early warnings for costly network degradation.
Interface analysis
Interface analysis view charting error and discard trends per interface over time.
Key technical benefits

What the engineering team gets.

  • Start troubleshooting almost immediately, with millions of real-time syslogs ingested.
  • Save hours of troubleshooting by turning network error logs into dashboard insights and an AI assistant.
  • Get an early warning system from trends and classification of errors.
  • Let multiple engineers and sysadmins use the platform at the same time.
  • Speed up operations reporting with visualizations and analytics dashboards.
  • Correlate issues within minutes, with ML algorithms that identify possibly related error logs.
Works with what you run

Device library and supported vendors.

  • Cisco
  • Juniper
  • F5
  • Palo Alto
  • A10 Networks
  • Fortinet
  • Nokia
  • Ericsson
  • Linux
  • Windows
  • MySQL
  • Apache

Network

  • Cisco routers and switches
  • Juniper firewalls and switches
  • A10 load balancers
  • F5 load balancers
  • Palo Alto firewalls

Application

  • Virtualization
  • Linux and Windows servers
  • Web servers
  • Databases
  • Middleware and APIs

Core services

  • DNS
  • Routing and BGP
  • Inventory and CMDB
  • CDN, IP and video services
  • Device configurations
Explainer

Take a glimpse of PulsarOps AI.

Platform overview
Book a demo

Walk through the platform with an engineer.

Thirty minutes on the PulsarOps demo environment.